
Source Comparison and Testing
Source Comparison
In 2017 SSF realized a decrease in the funding rate of large crustal scale seismic projects. However, the demand for smaller scale projects increased leading to source comparison testing. This source comparison test does an approximate side-by-side comparison of small point sources related to shallower seismic projects. The testing was completed at the SSF test facility in West Texas (below). All sources (red dots below) were recorded with 25 Reftek RT-125A recording instruments using 4.5Hz geophones (green dots below). All locations were surveyed with RTK GPS for position accuracies less than 50mm (2").
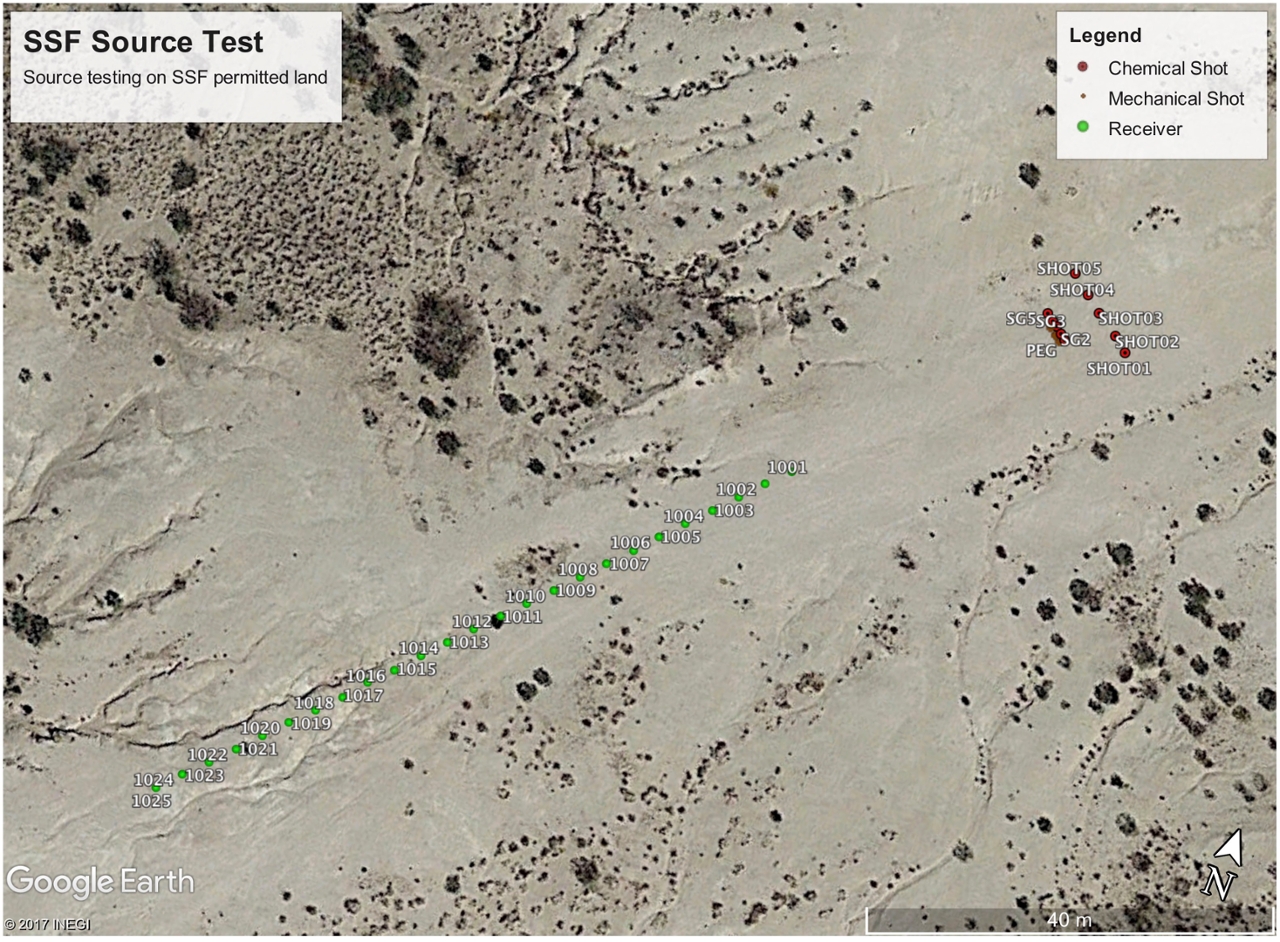
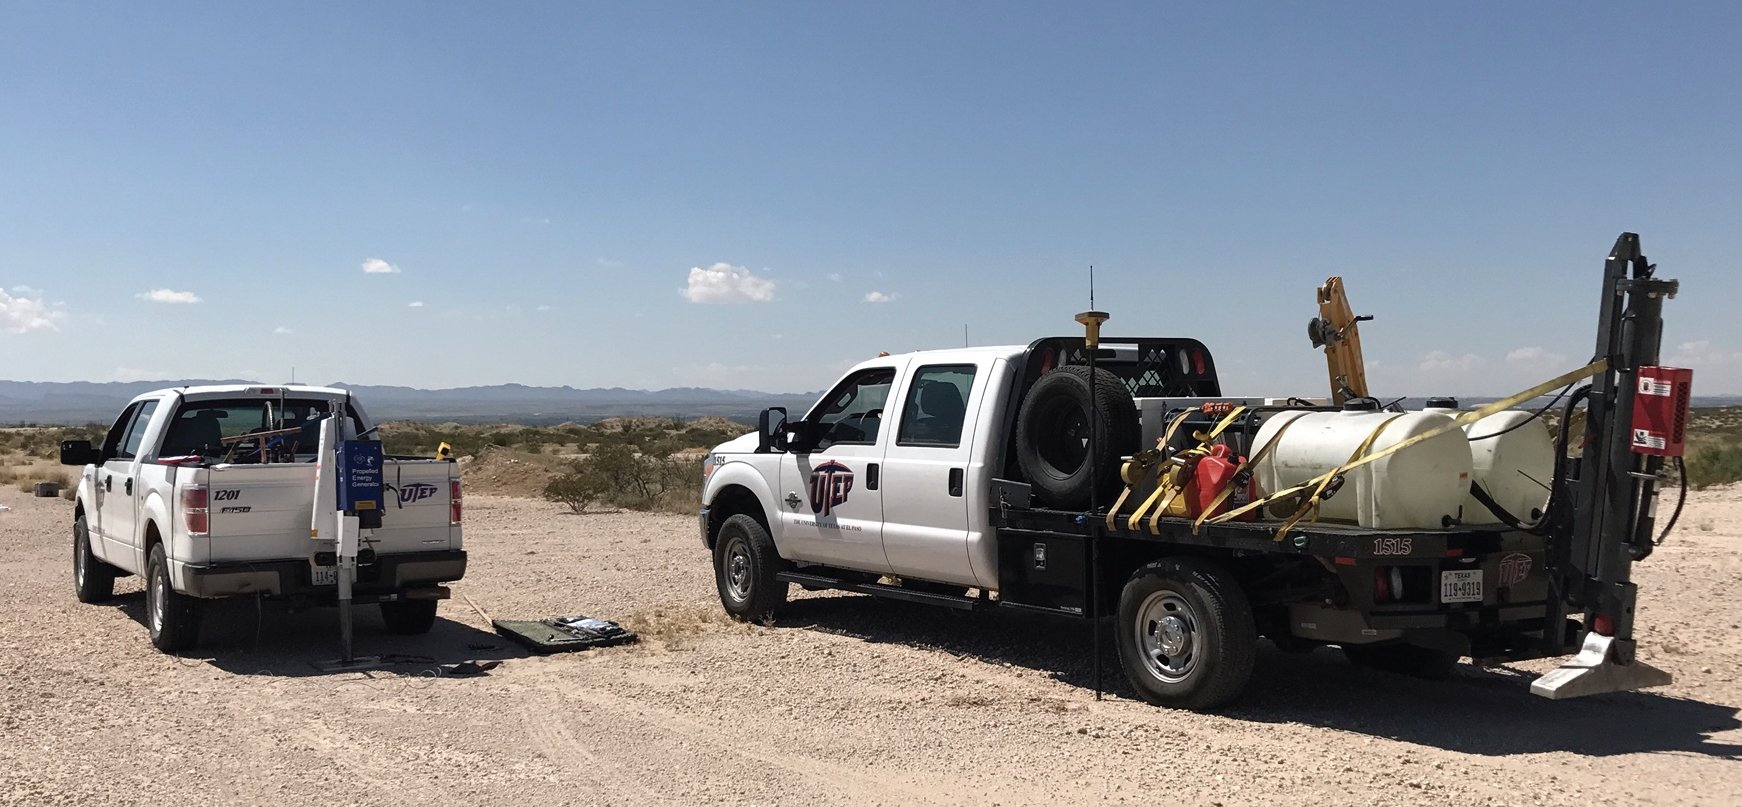
The mechanical sources included 5.5kg (12lb.) and 9kg (20lb.) hammers, PEG-40 (below left), A200 P&S
(below right, P-configuration). The chemical sources included shotgun (8 gauge, 400 grain shotshell), and 151g pentolite explosive charges. Mechanical sources were tested at the ground surface (same location). The chemical sources required drilling 63.5mm (2.5") diameter holes to 0.45m (18") below ground surface (bgs) for the shotgun to 1.1m (3.5') bgs for the explosive charges (not same location due to ground disturbance). Drilling was done using SSF "Little Beaver" drill.
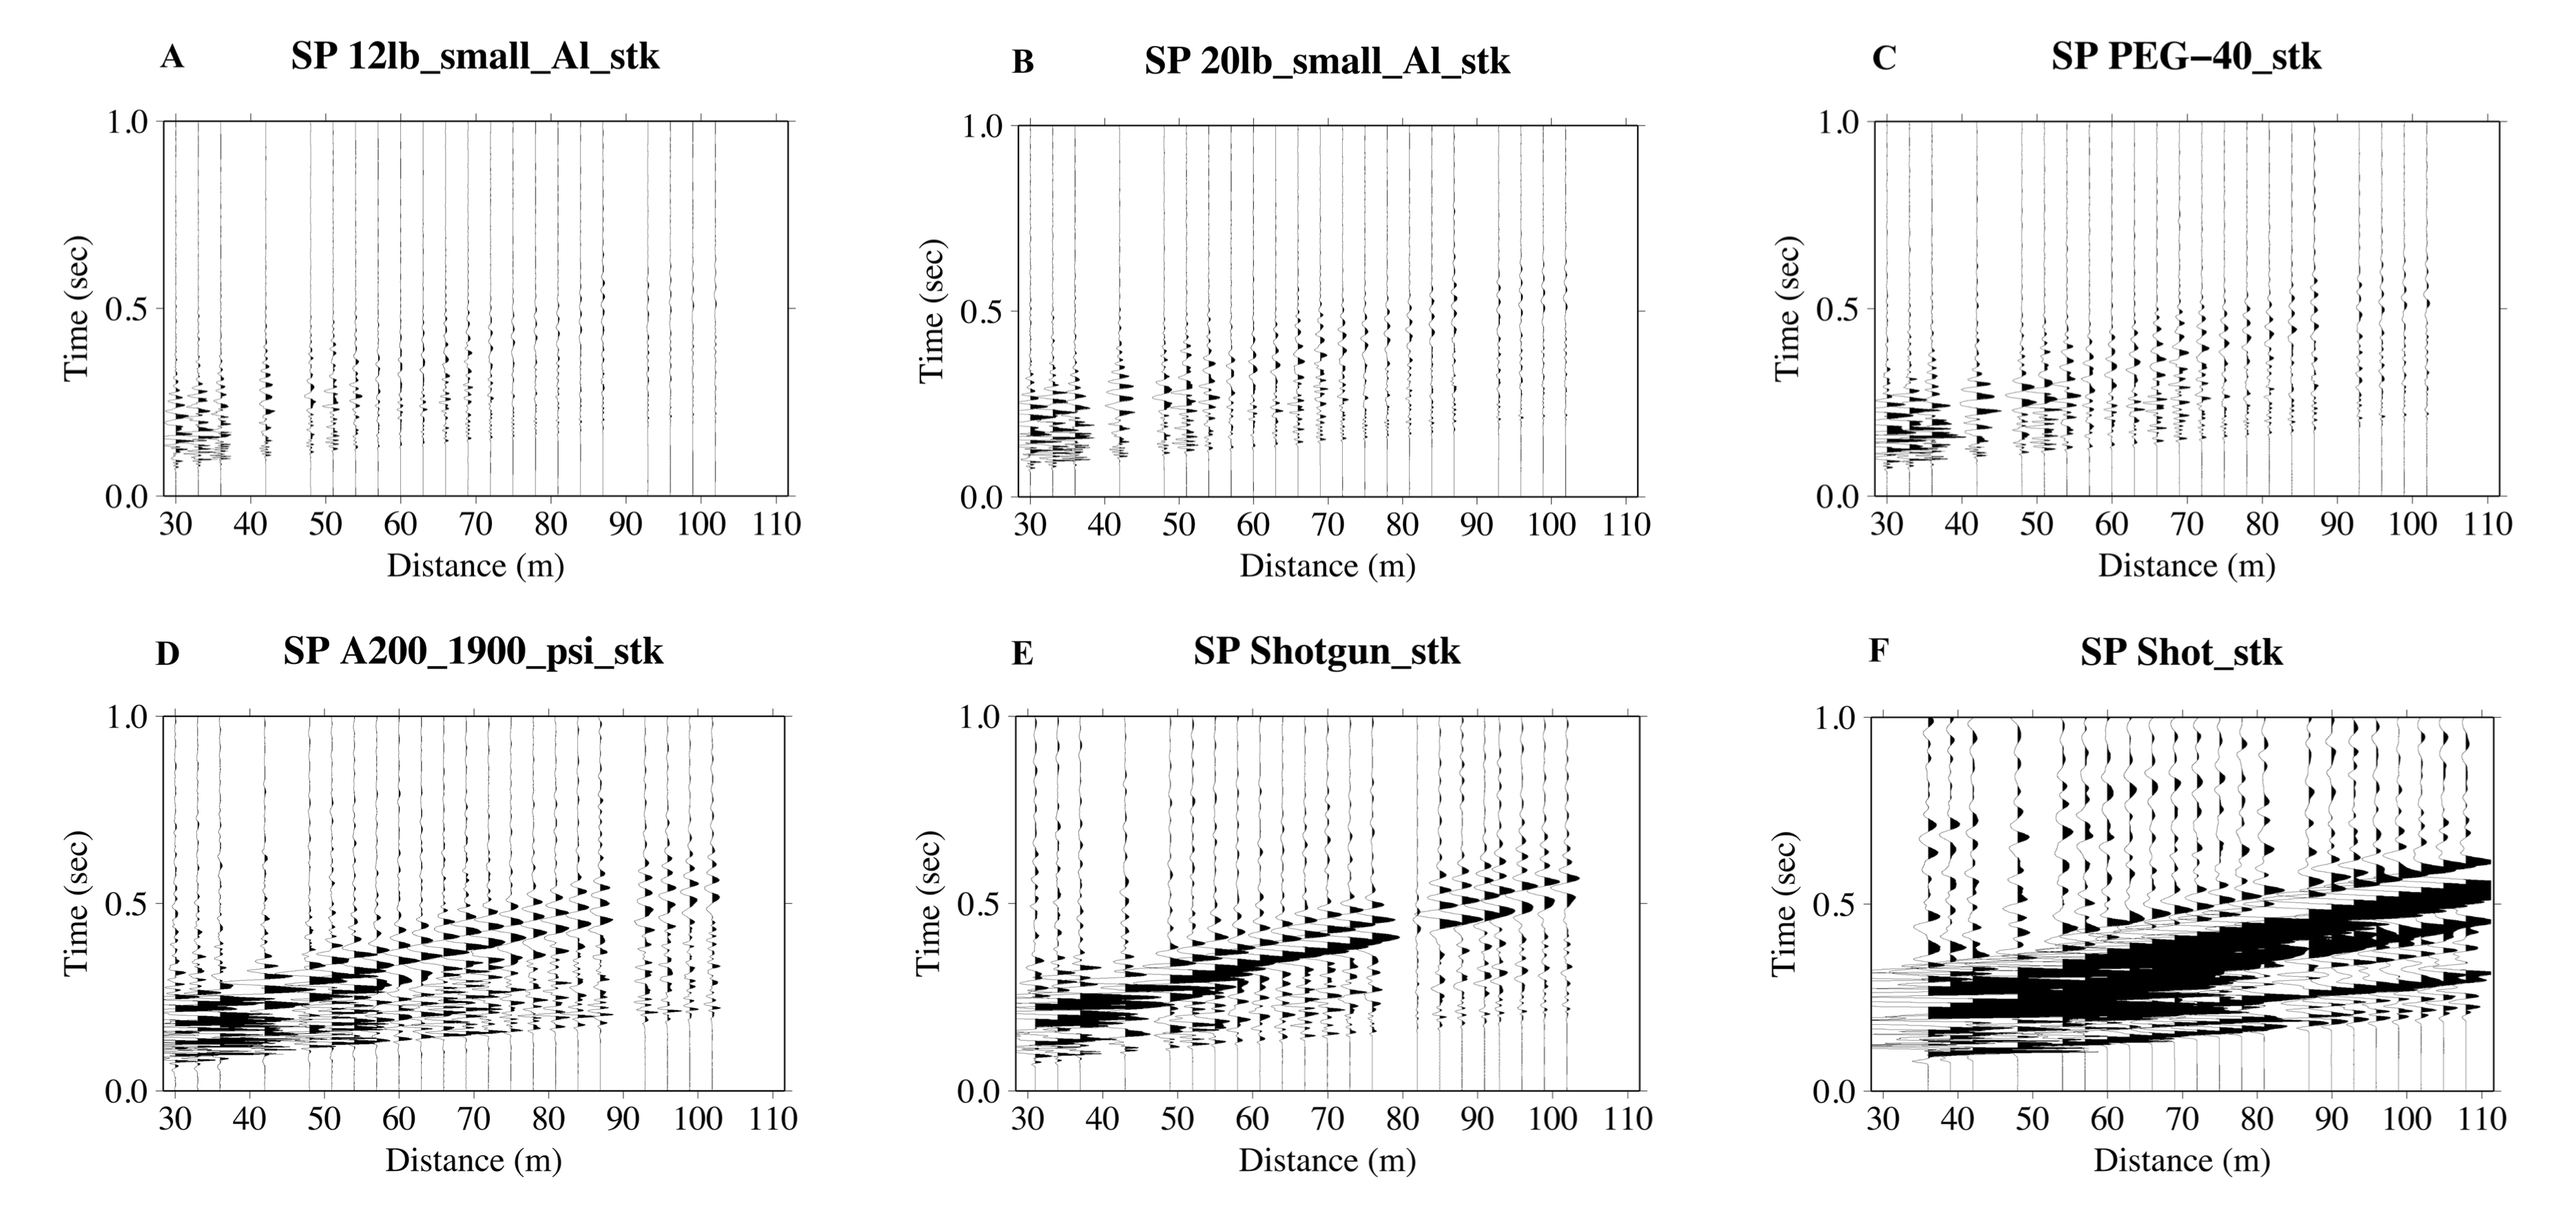
The shot gathers above are unnormalized, unfiltered and stacked (5 shots) for apples-to-apples. A. Shot gather using a 5.5kg (12lb.) hammer on a 19x19x1.9cm (7.5"x7.5"x3/4") aluminum plate. B. Shot gather using a 9.1 kg (20lb.) hammer on a 19x19x1.9cm (7.5"x7.5"x3/4") aluminum plate. C. Shot gather using a PEG-40 (36kg, (80lb.)) accelerated weight drop on a 46x46x2.5cm (18"x18"x1") aluminum plate. D. Shot gather using a A200 P&S (98kg, (216lb.)) accelerated weight drop with nitrogen spotting set at 1,900psi. E. Shot gather using Betsy seisgun with 8ga., 26g (400gr) blanks 0.5m (18") bgs. F. Shot gather using 151g (1/3lb.) pentolite charge approximately 1.1 (3.5') bgs.
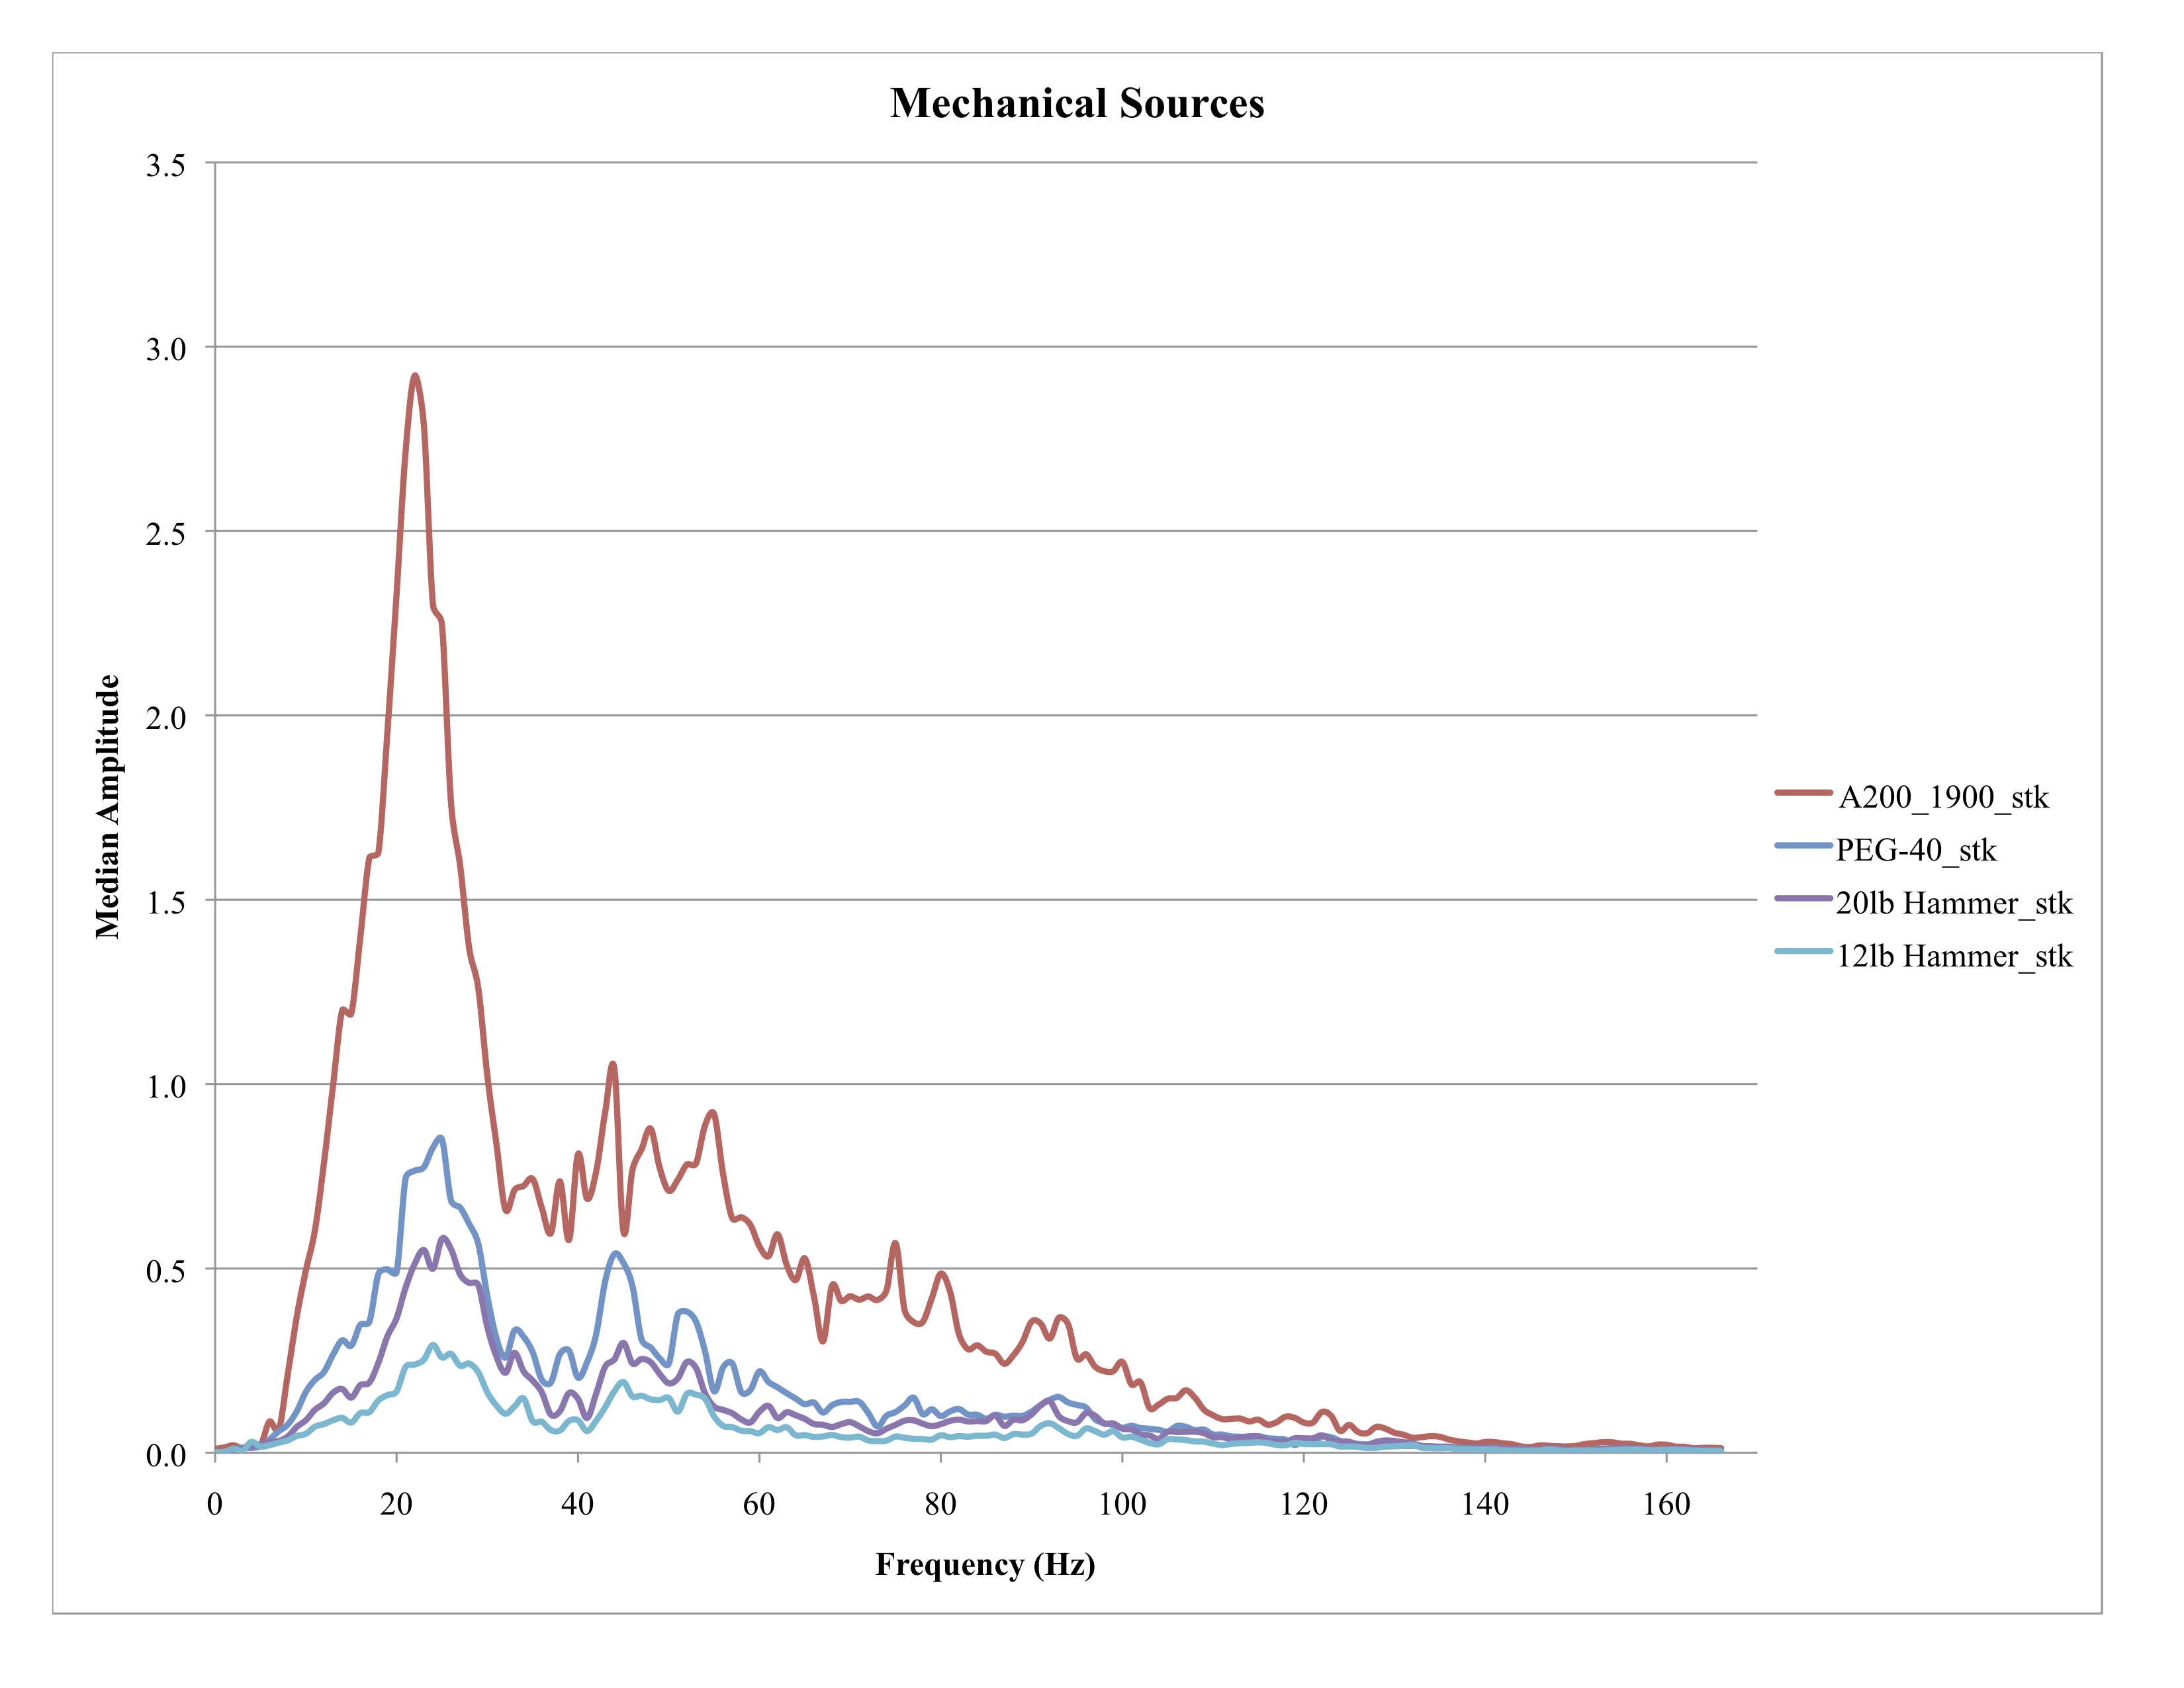
The plot above is related to the mechanical sources (hammers and accelerated weight drops). It shows median amplitude vs. frequency for time window 0 to 1 second for the related shots. The individual shots were stacked (sum of 5 shots) to show increased amplitude with better signal to noise ratio (real data adds and noise subtracts). These sources are very easy to stack at the same surface location.
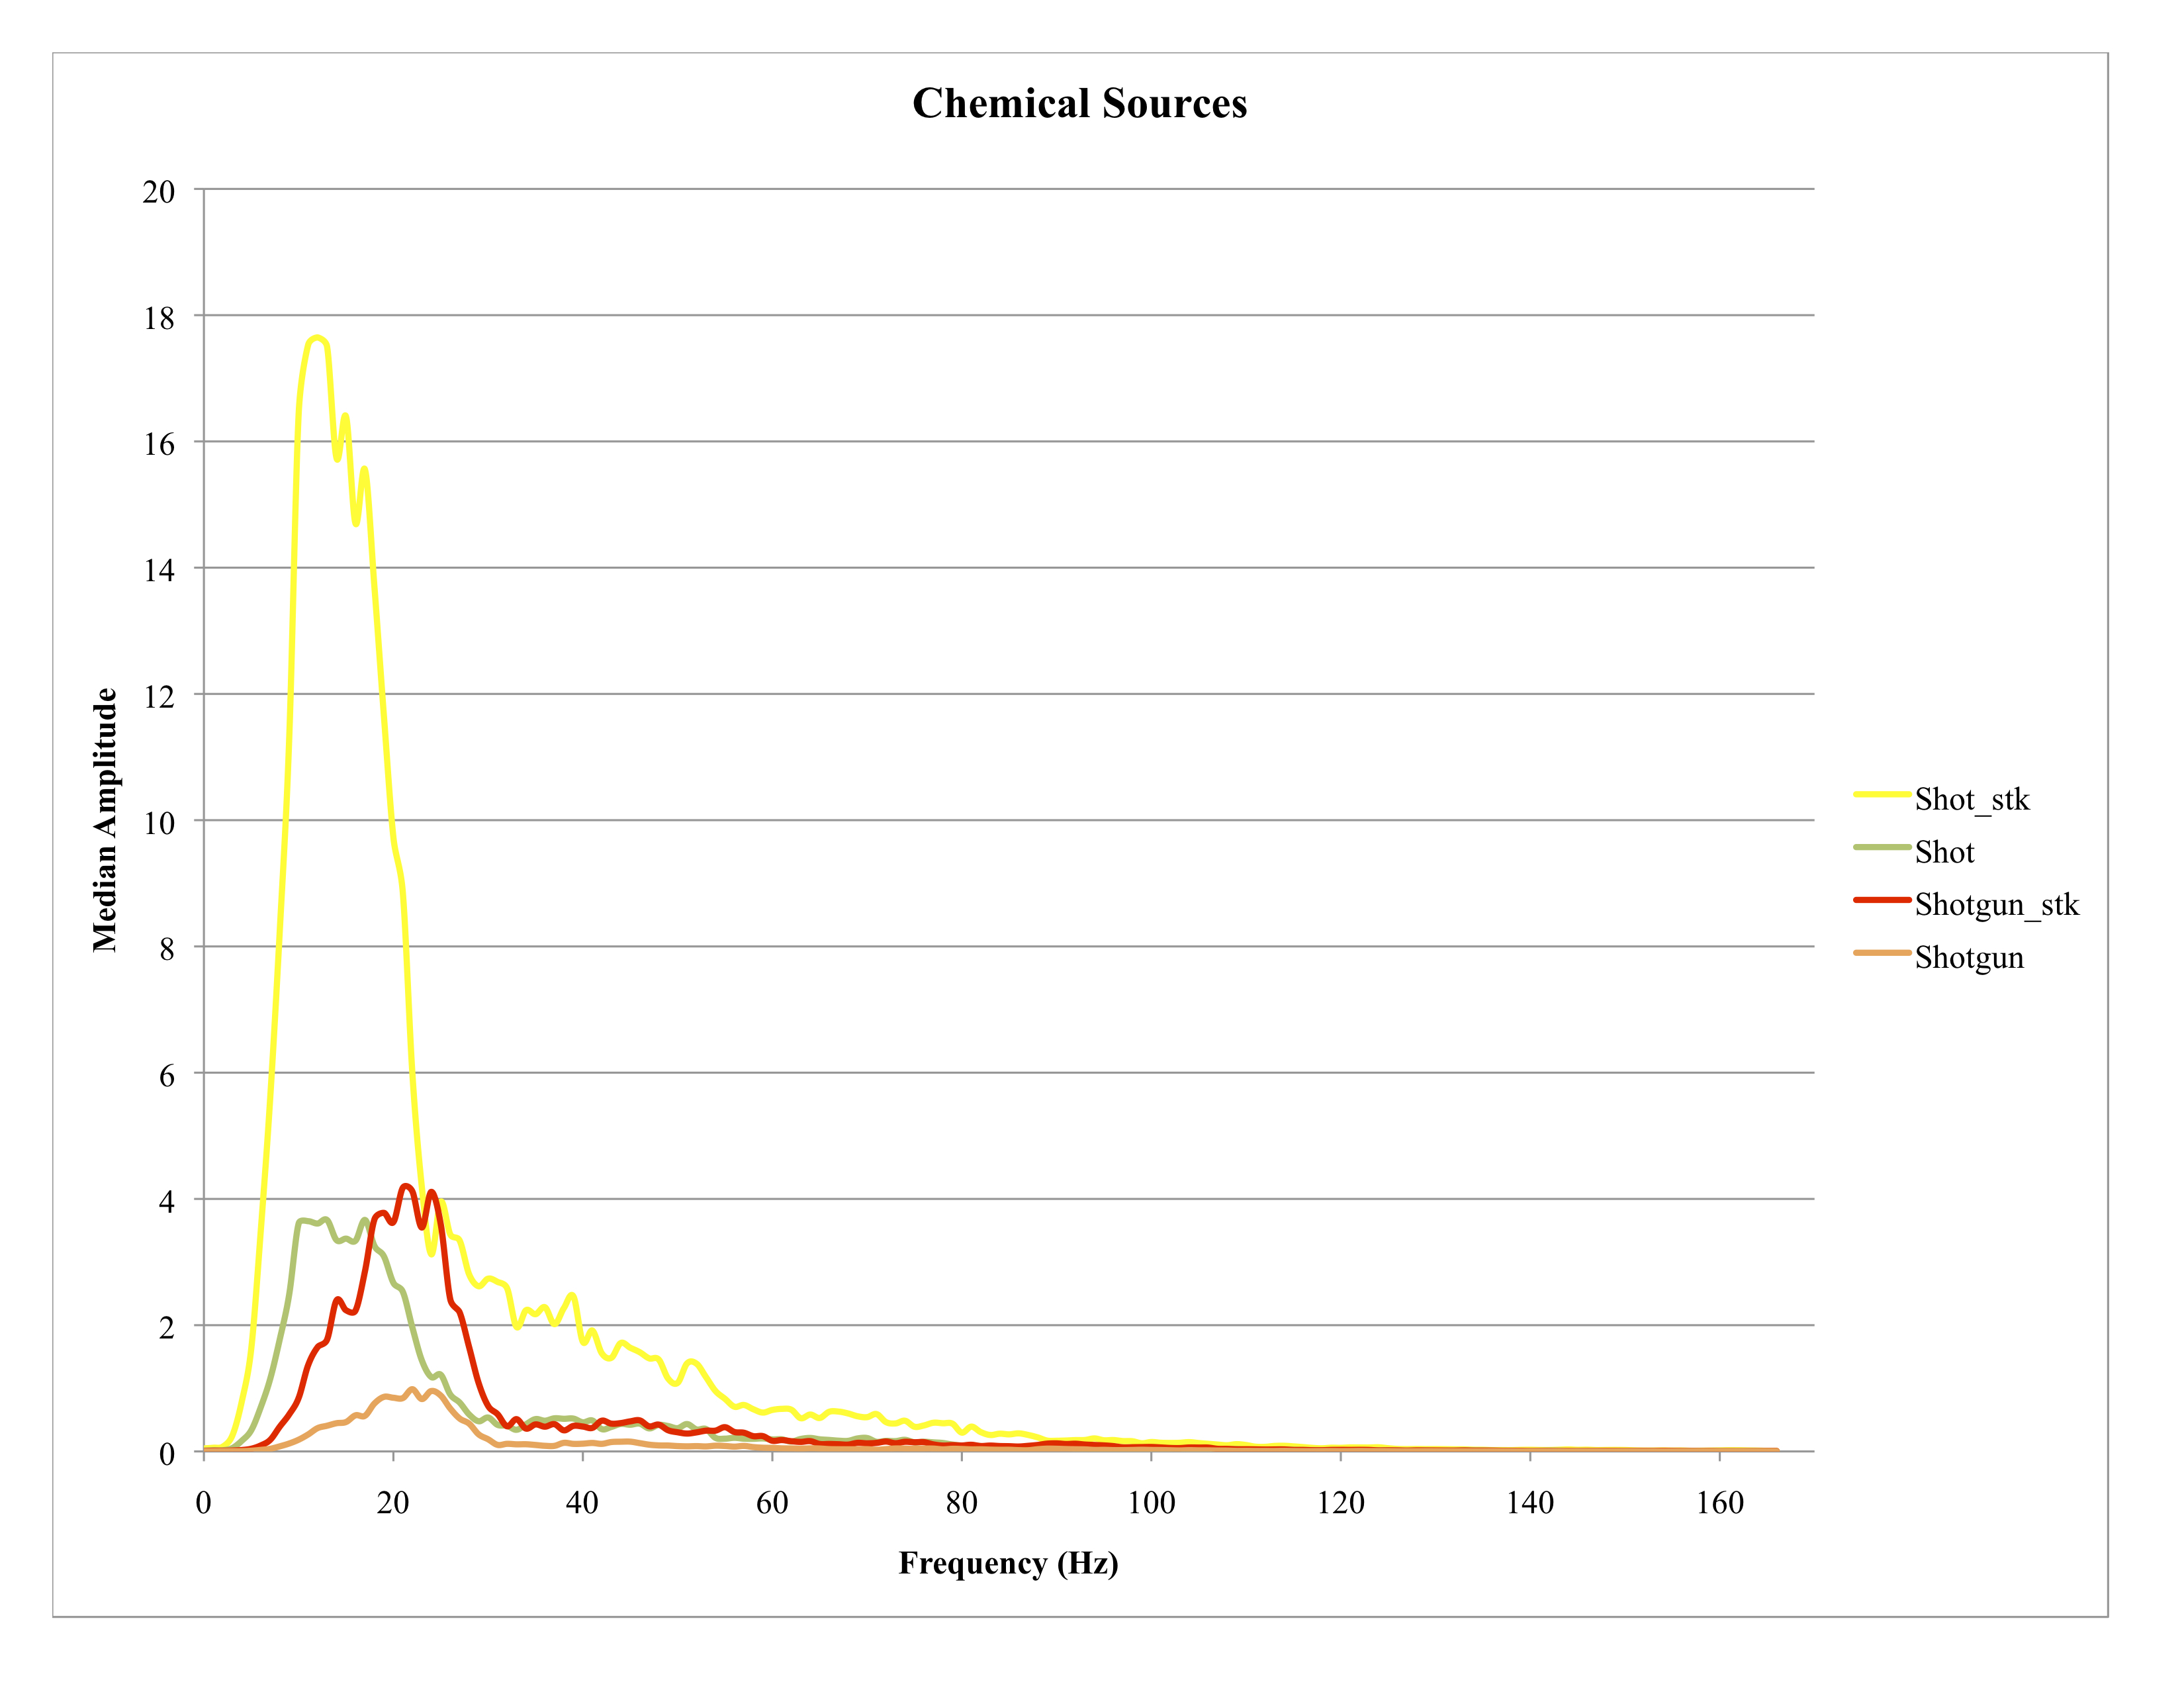
The plot above is related to the chemical sources (shotgun blanks and pentolite charges). It shows median amplitude vs. frequency for time window 0 to 1 second for the related shots. This plot shows individual shots and stacked shots (sum of 5 shots) to show increased amplitude with better signal to noise ratio (real data adds and noise subtracts). These sources are not easy to stack due to damage related to firing. They also would require drilling multiple drill holes which is very time consuming.
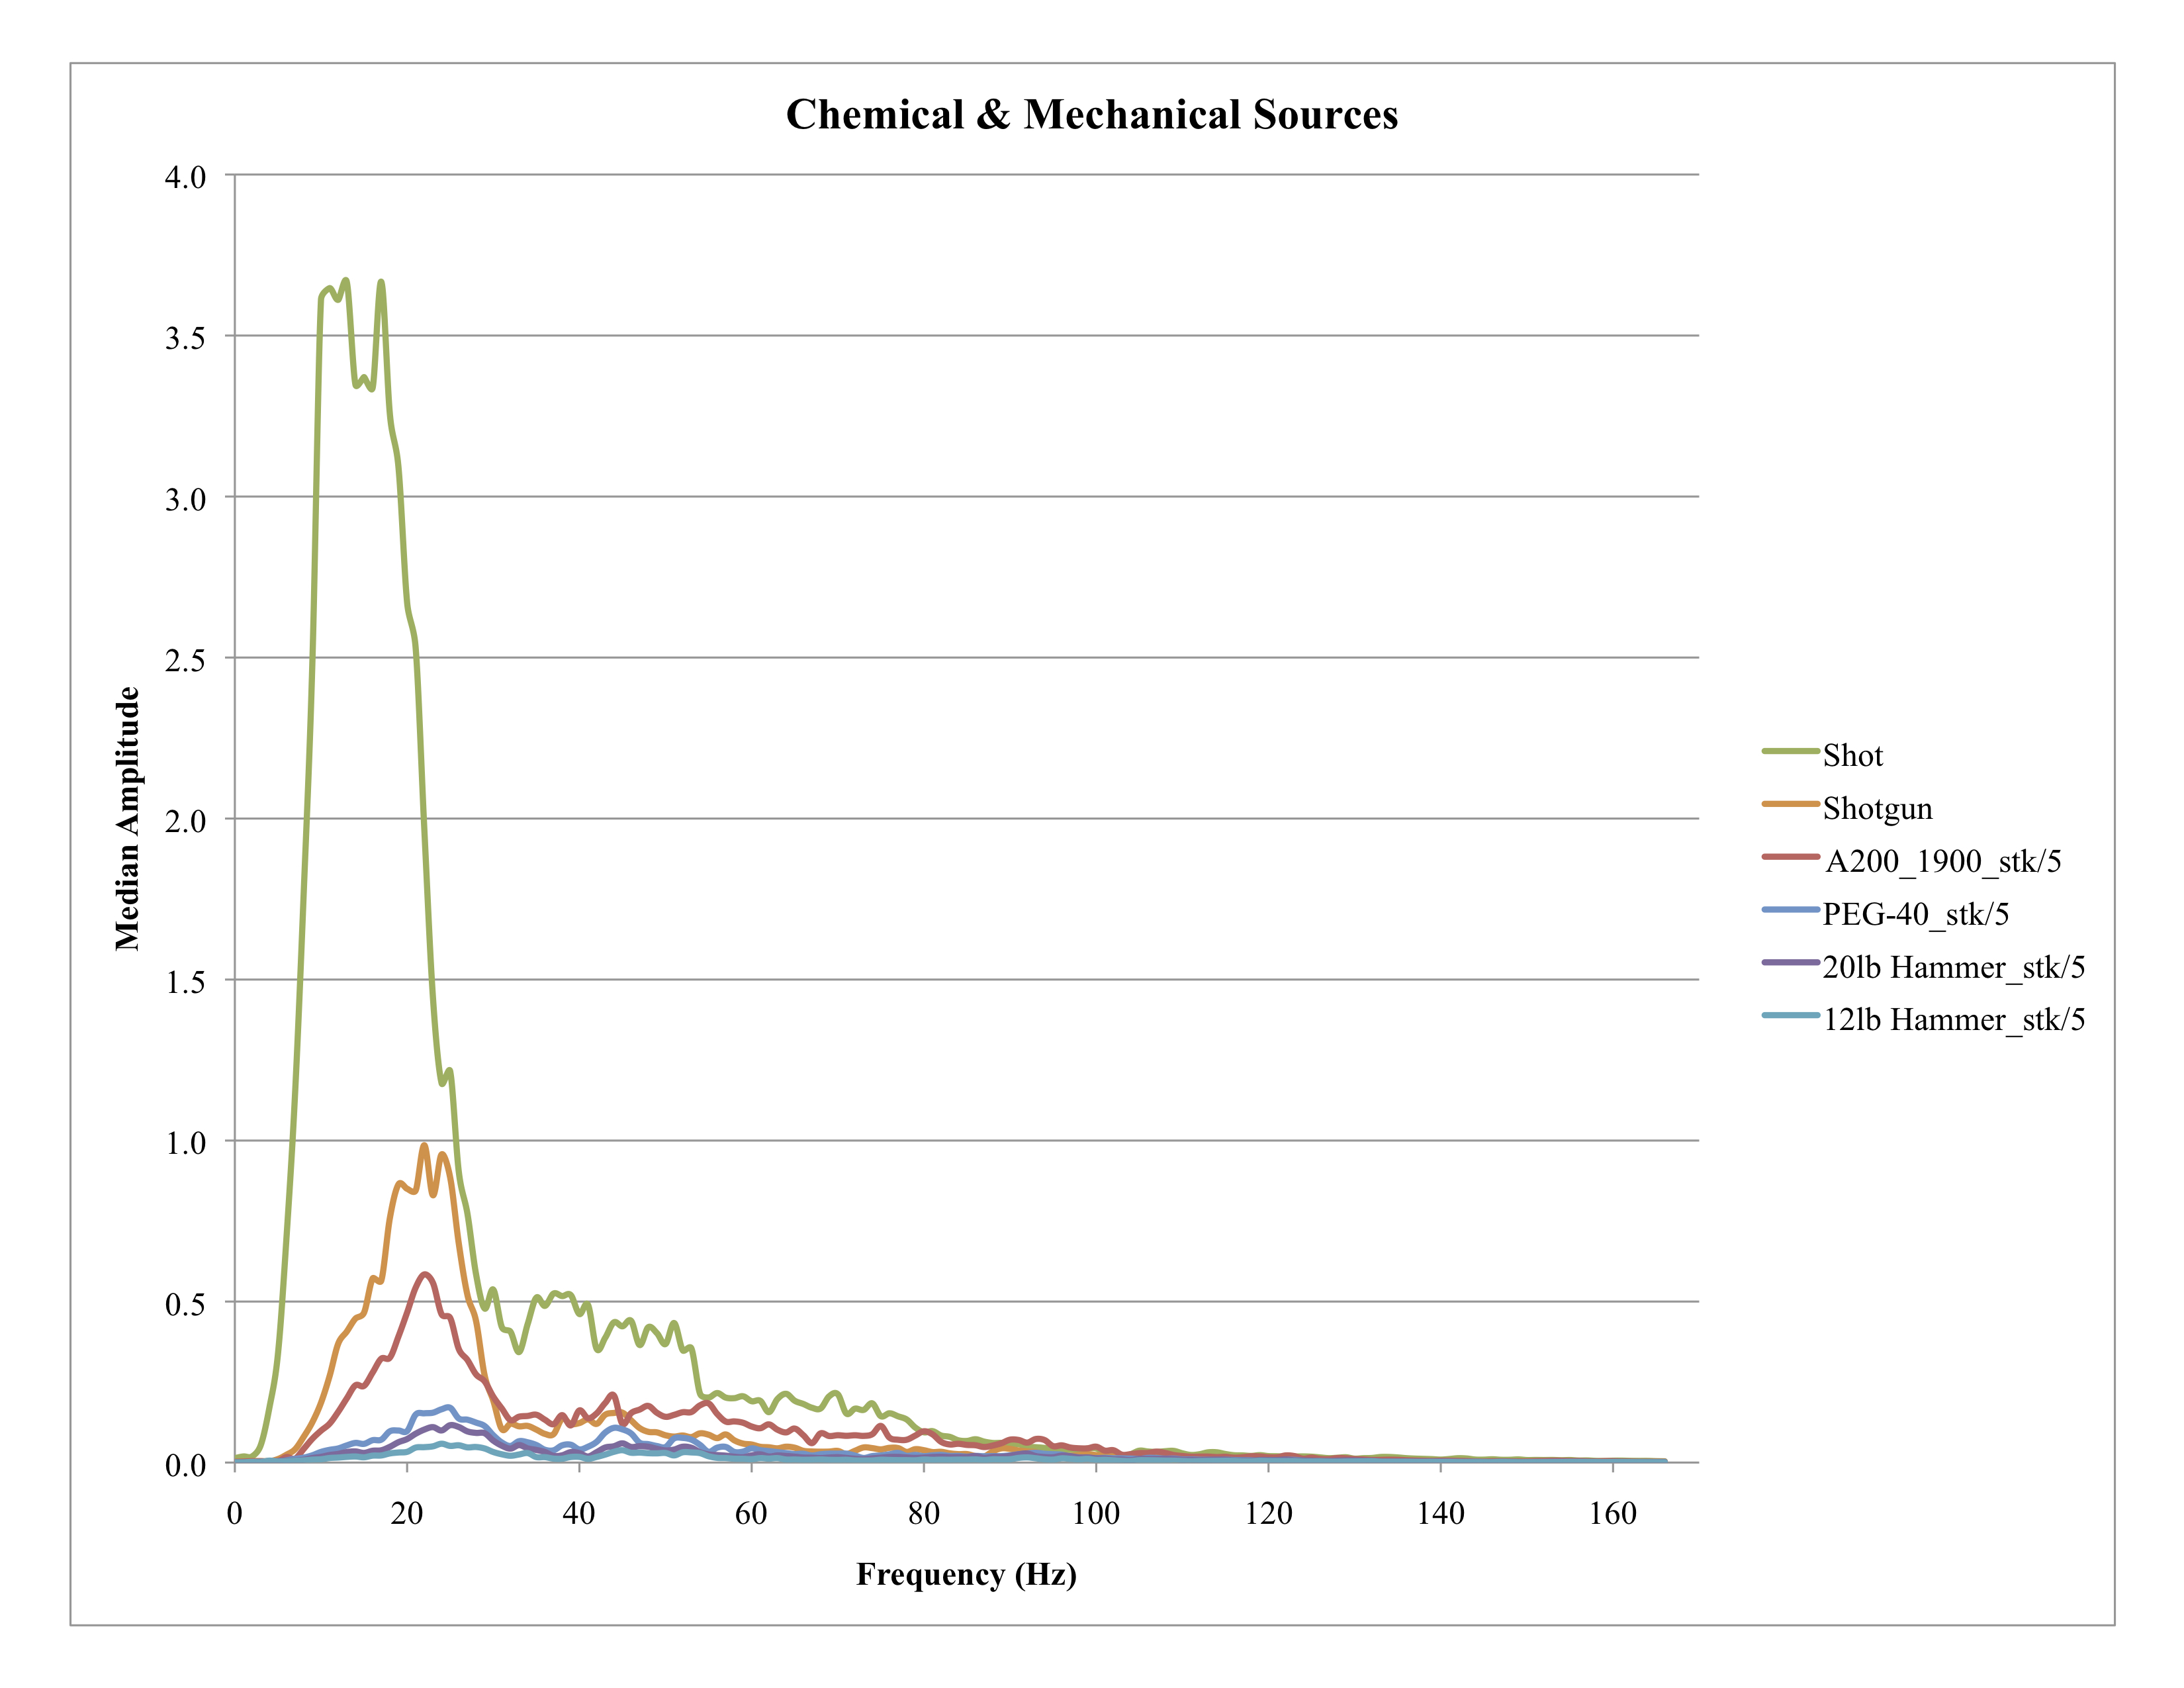
The plot above is related to the chemical sources (shotgun blanks and pentolite charges) and mechanical sources (hammers and accelerated weight drops). In order to maintain apples-to-apples comparison, the chemical shots were not stacked and the mechanical shots were stacked but divided by 5 (stk/5) to maintain relative amplitudes. Generally, chemical shots are done with one charge and mechanical shots are stacked to improve signal to noise ratio. It shows median amplitude vs. frequency for time window 0 to 1 second for the related shots.
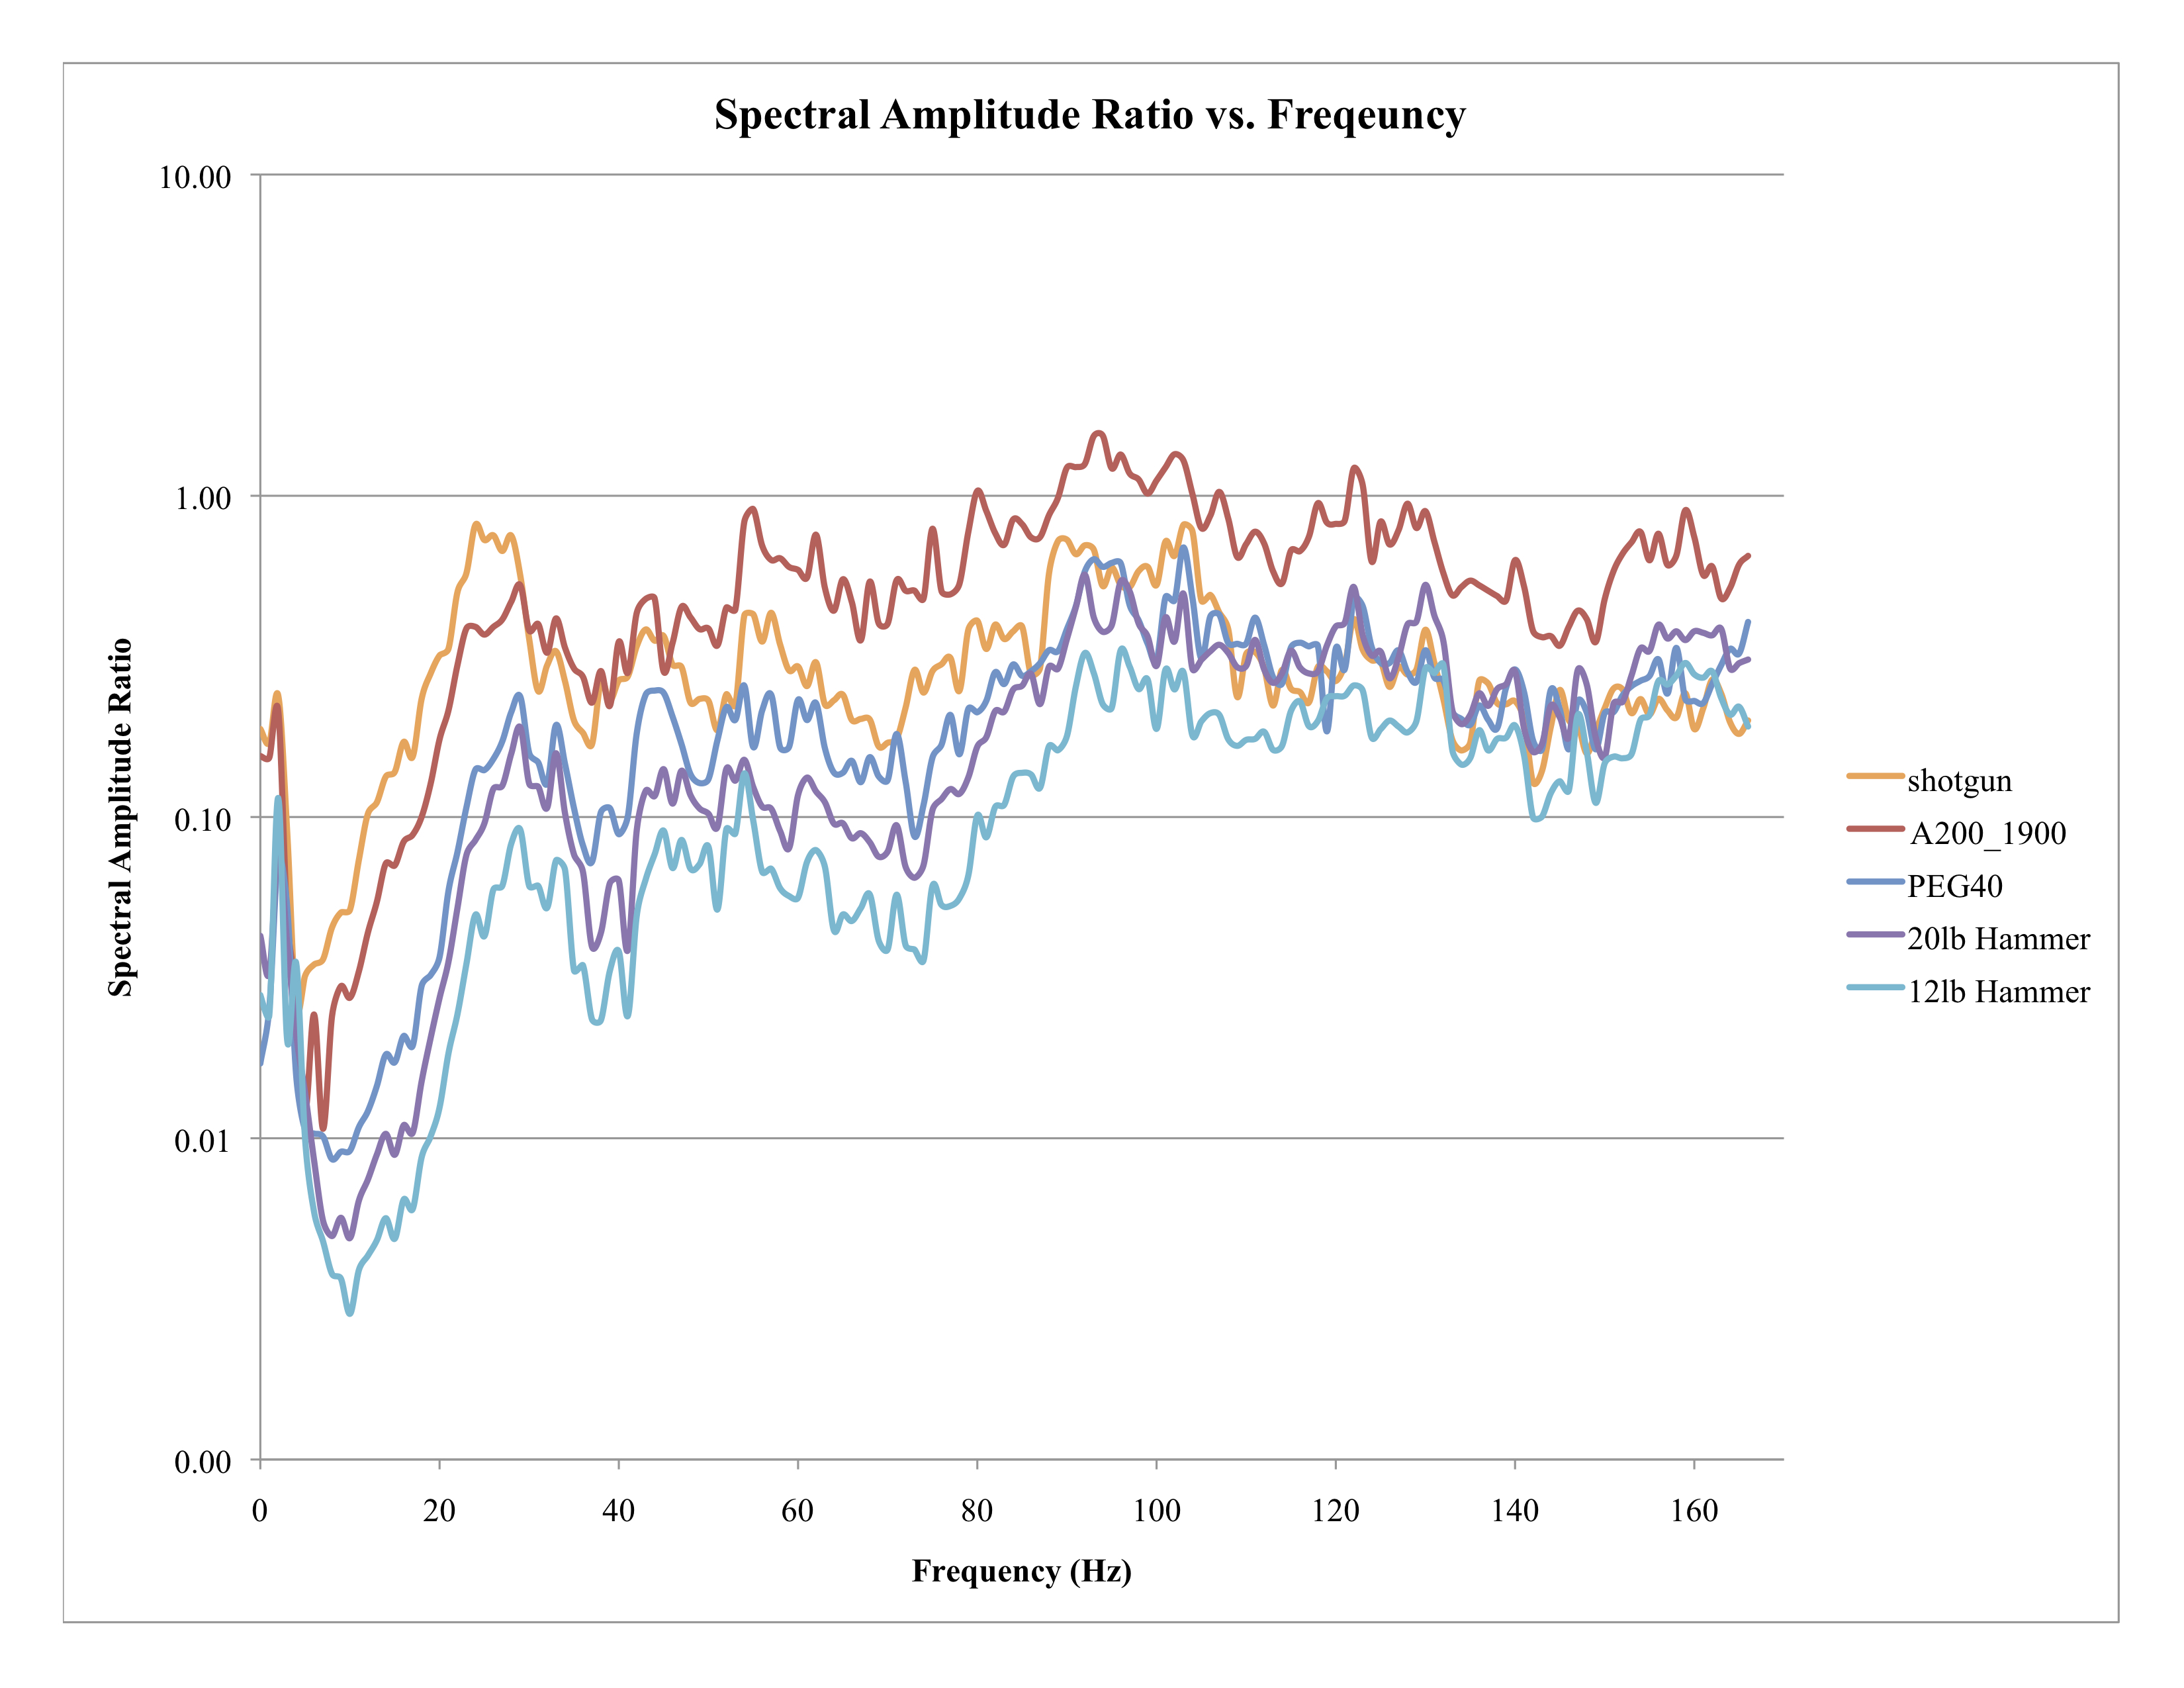
The plot above is the median spectral amplitude ratio vs. frequency of all sources from the plot "Chemical & Mechanical Sources" related to a single 151g pentolite shot. This gives a good comparison of amplitude and frequency of the smaller shots related to the largest (151g pentolite). It is very important to note that the A200 P&S source has higher amplitudes in the frequencies range between 90 to 110Hz related to the pentolite shot and higher than the shotgun above 50Hz.
Testing
Coming Soon!


